PAVICS Components
Contents
Scheduler
This component provides automated unattended continuous deployment for the
“PAVICS stack” (all the git repos in var AUTODEPLOY_EXTRA_REPOS), for the
tutorial notebooks on the Jupyter environment and for the automated deployment
itself.
It can also be used to schedule other tasks on the PAVICS physical host.
Everything is dockerized, the deployment runs inside a container that will update all other containers.
Automated unattended continuous deployment means if code change in the remote
repo, matching the same currently checkout branch (ex: config changes,
docker-compose.yml changes) a deployment will be performed automatically
without human intervention.
The trigger for the deployment is new code change on the server on the current branch (PR merged, push). New code change locally will not trigger deployment so local development workflow is also supported.
Multiple remote repos are supported so the “PAVICS stack” can be made of
multiple checkouts for modularity and extensibility. The autodeploy will
trigger if any of the checkouts (configured in AUTODEPLOY_EXTRA_REPOS) is
not up-to-date with its remote repo.
A suggested “PAVICS stack” is made of at least 2 repos, this repo and another
private repo containing the source controlled env.local file and any other
docker-compose override for true infrastructure-as-code.
Note: there are still cases where a human intervention is needed. See note in
script deploy.sh (download).
Usage
Given the unattended nature, there is no UI. Logs are used to keep trace.
/var/log/PAVICS/autodeploy.logis for the PAVICS deployment./var/log/PAVICS/notebookdeploy.logis for the tutorial notebooks deployment.logrotate is enabled for
/var/log/PAVICS/*.logto avoid filling up the disk. Any new.logfiles in that folder will get logrotate for free.
How to Enable the Component
Edit
env.local(a copy of env.local.example (download))Add “./components/scheduler” to
EXTRA_CONF_DIRS.Set
AUTODEPLOY_EXTRA_REPOS,AUTODEPLOY_DEPLOY_KEY_ROOT_DIR,AUTODEPLOY_PLATFORM_FREQUENCY,AUTODEPLOY_NOTEBOOK_FREQUENCYas desired, full documentation in env.local.example.Run once fix-write-perm (
download), see doc in script.
Old way to deploy the automatic deployment
Superseded by this new scheduler component. Keeping for reference only.
Doing it this old way do not need the scheduler component but lose the
ability for the autodeploy system to update itself.
Configure logrotate for all following automations to prevent disk full:
deployment/install-logrotate-config .. $USER
To enable continuous deployment of PAVICS:
deployment/install-automated-deployment.sh .. $USER [daily|5-mins]
# read the script for more options/details
If you want to manually force a deployment of PAVICS (note this might not use
latest version of deploy.sh script (download):
deployment/deploy.sh .
# read the script for more options/details
To enable continuous deployment of tutorial Jupyter notebooks:
deployment/install-deploy-notebook .. $USER
# read the script for more details
To trigger tutorial Jupyter notebooks deploy manually:
# configure logrotate before because this script will log to
# /var/log/PAVICS/notebookdeploy.log

deployment/trigger-deploy-notebook
# read the script for more details
Migrating to the new mechanism requires manual deletion of all the artifacts
created by the old install scripts: sudo rm /etc/cron.d/PAVICS-deploy
/etc/cron.hourly/PAVICS-deploy-notebooks /etc/logrotate.d/PAVICS-deploy
/usr/local/sbin/triggerdeploy.sh. Both can not co-exist at the same time.
Comparison between the old and new autodeploy mechanism
Maximum backward-compatibility has been kept with the old install scripts style:
Still log to the same existing log files under
/var/log/PAVICS.Old single ssh deploy key is still compatible, but the new mechanism allows for different ssh deploy keys for each extra repos (again, public repos should use https clone path to avoid dealing with ssh deploy keys in the first place).
Old install scripts are kept and can still deploy the old way.
Features missing in old install scripts or how the new mechanism improves on the old install scripts:
Autodeploy of the autodeploy itself ! This is the biggest win. Previously, if triggerdeploy.sh (
download) or the deployed/etc/cron.hourly/PAVICS-deploy-notebooksscript changes, they have to be deployed manually. It’s very annoying. Now they are volume-mount in so are fresh on each run.env.localnow drives absolutely everything, source control that file and we’ve got a true DevOPS pipeline.Configurable platform and notebook autodeploy frequency. Previously, this means manually editing the generated cron file, less ideal.
Do not need any support on the local host other than
dockeranddocker-compose.cron/logrotate/git/sshversions are all locked-down in the docker images used by the autodeploy. Recall previously we had to deal with git version too old on some hosts.Each cron job run in its own docker image meaning the runtime environment is traceable and reproducible.
The newly introduced scheduler component is made extensible so other jobs can added into it as well (ex: backup), via
env.local, which should be source controlled, meaning all surrounding maintenance related tasks can also be traceable and reproducible.
Monitoring
This component provides monitoring and alerting for the PAVICS physical host and containers.
Prometheus stack is used:
Node-exporter to collect host metrics.
cAdvisor to collect containers metrics.
Prometheus to scrape metrics, to store them and to query them.
AlertManager to manage alerts: deduplicate, group, route, silence, inhibit.
Grafana to provide visualization dashboard for the metrics.
Usage
Grafana to view metric graphs: http://PAVICS_FQDN:3001/d/pf6xQMWGz/docker-and-system-monitoring
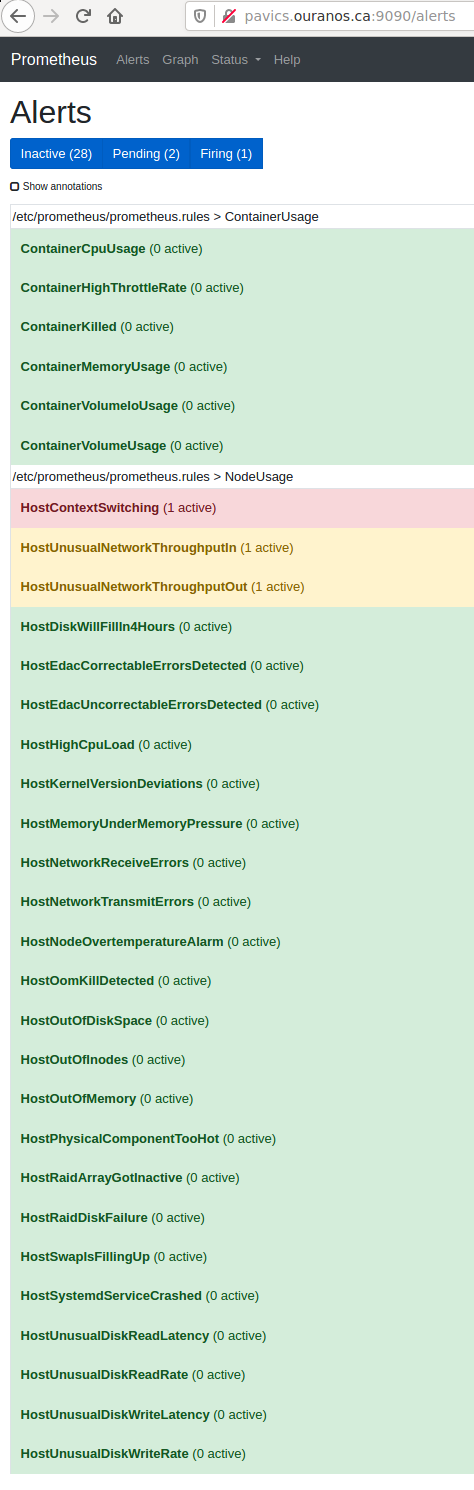
Prometheus alert rules: http://PAVICS_FQDN:9090/rules
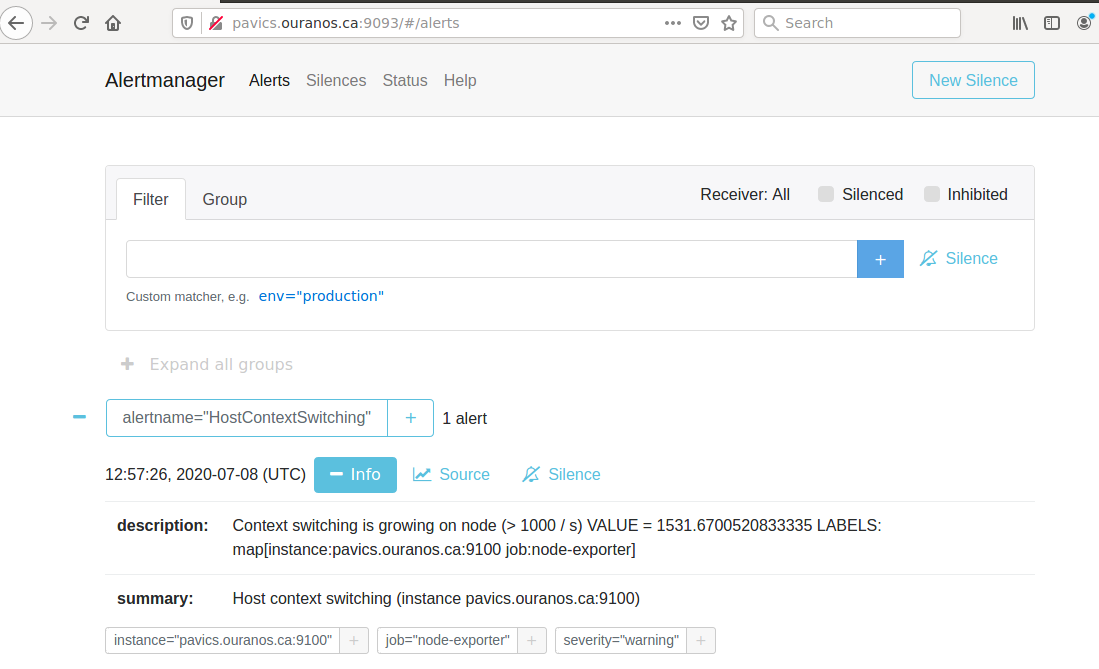
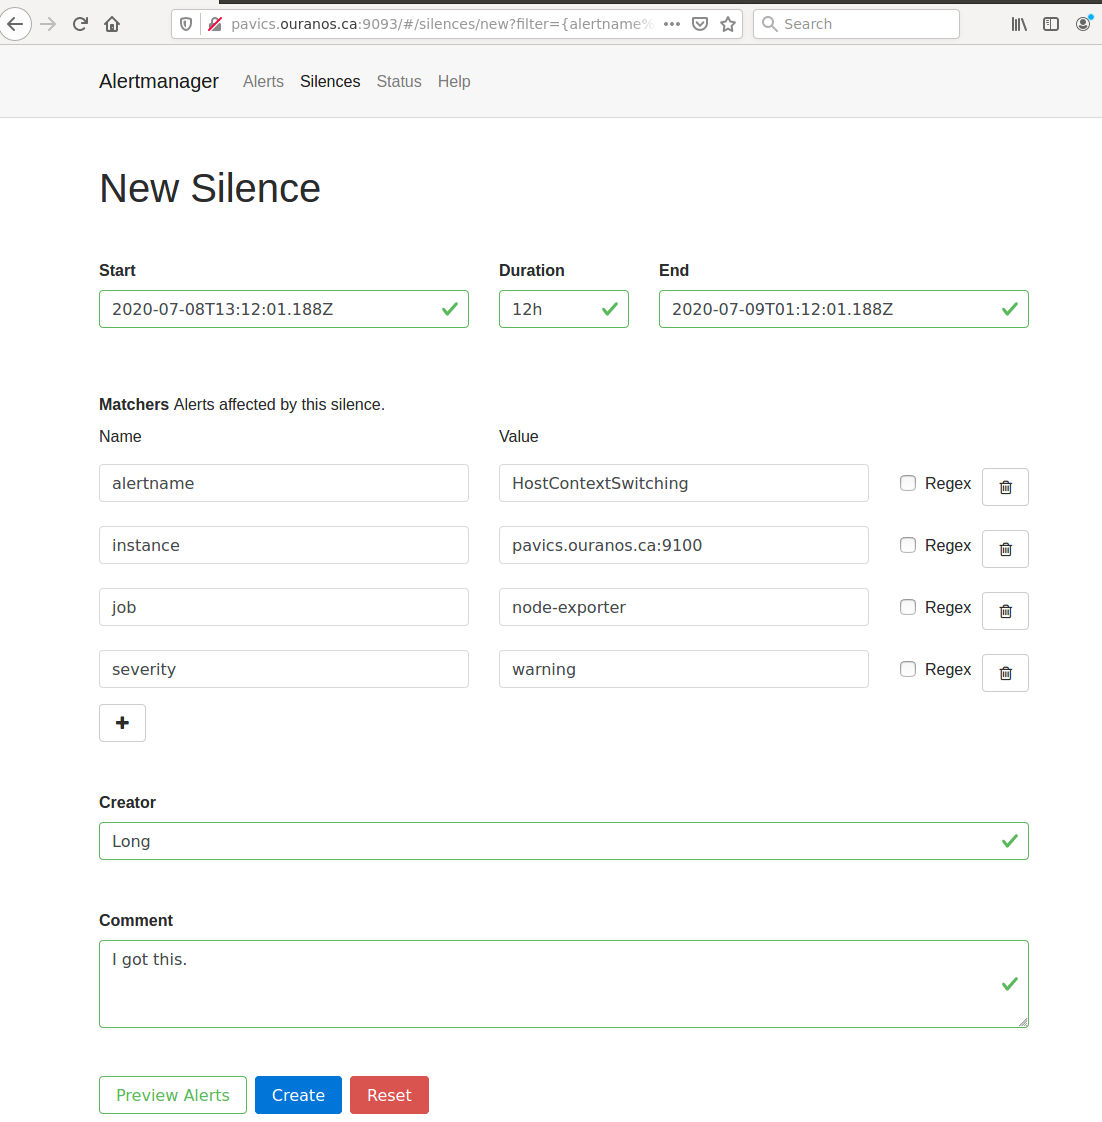
AlertManager to manage alerts: http://PAVICS_FQDN:9093
The paths above are purposely not behind the proxy to not expose them publicly, assuming only ports 80 and 443 are publicly exposed on the internet. All other ports are not exposed.
Only Grafana has authentication, Prometheus alert rules and AlertManager have no authentication at all so had they been behind the proxy, anyone will be able to access them.
How to Enable the Component
Edit
env.local(a copy of env.local.example (download))Add “./components/monitoring” to
EXTRA_CONF_DIRSSet
GRAFANA_ADMIN_PASSWORDto login to GrafanaSet
ALERTMANAGER_ADMIN_EMAIL_RECEIVERfor receiving alertsSet
SMTP_SERVERfor sending alertsOptionally set
ALERTMANAGER_EXTRA_GLOBALto further configure AlertManagerALERTMANAGER_EXTRA_ROUTESto add more routes than email notificationALERTMANAGER_EXTRA_INHIBITIONto disable rule from firingALERTMANAGER_EXTRA_RECEIVERSto add more receivers than the admin emails
Alert thresholds can be customized by setting the various
PROMETHEUS_*_ALERTvars inenv.local. The list ofPROMETHEUS_*_ALERTvars are in monitoring_default.env (download).
Grafana Dashboard
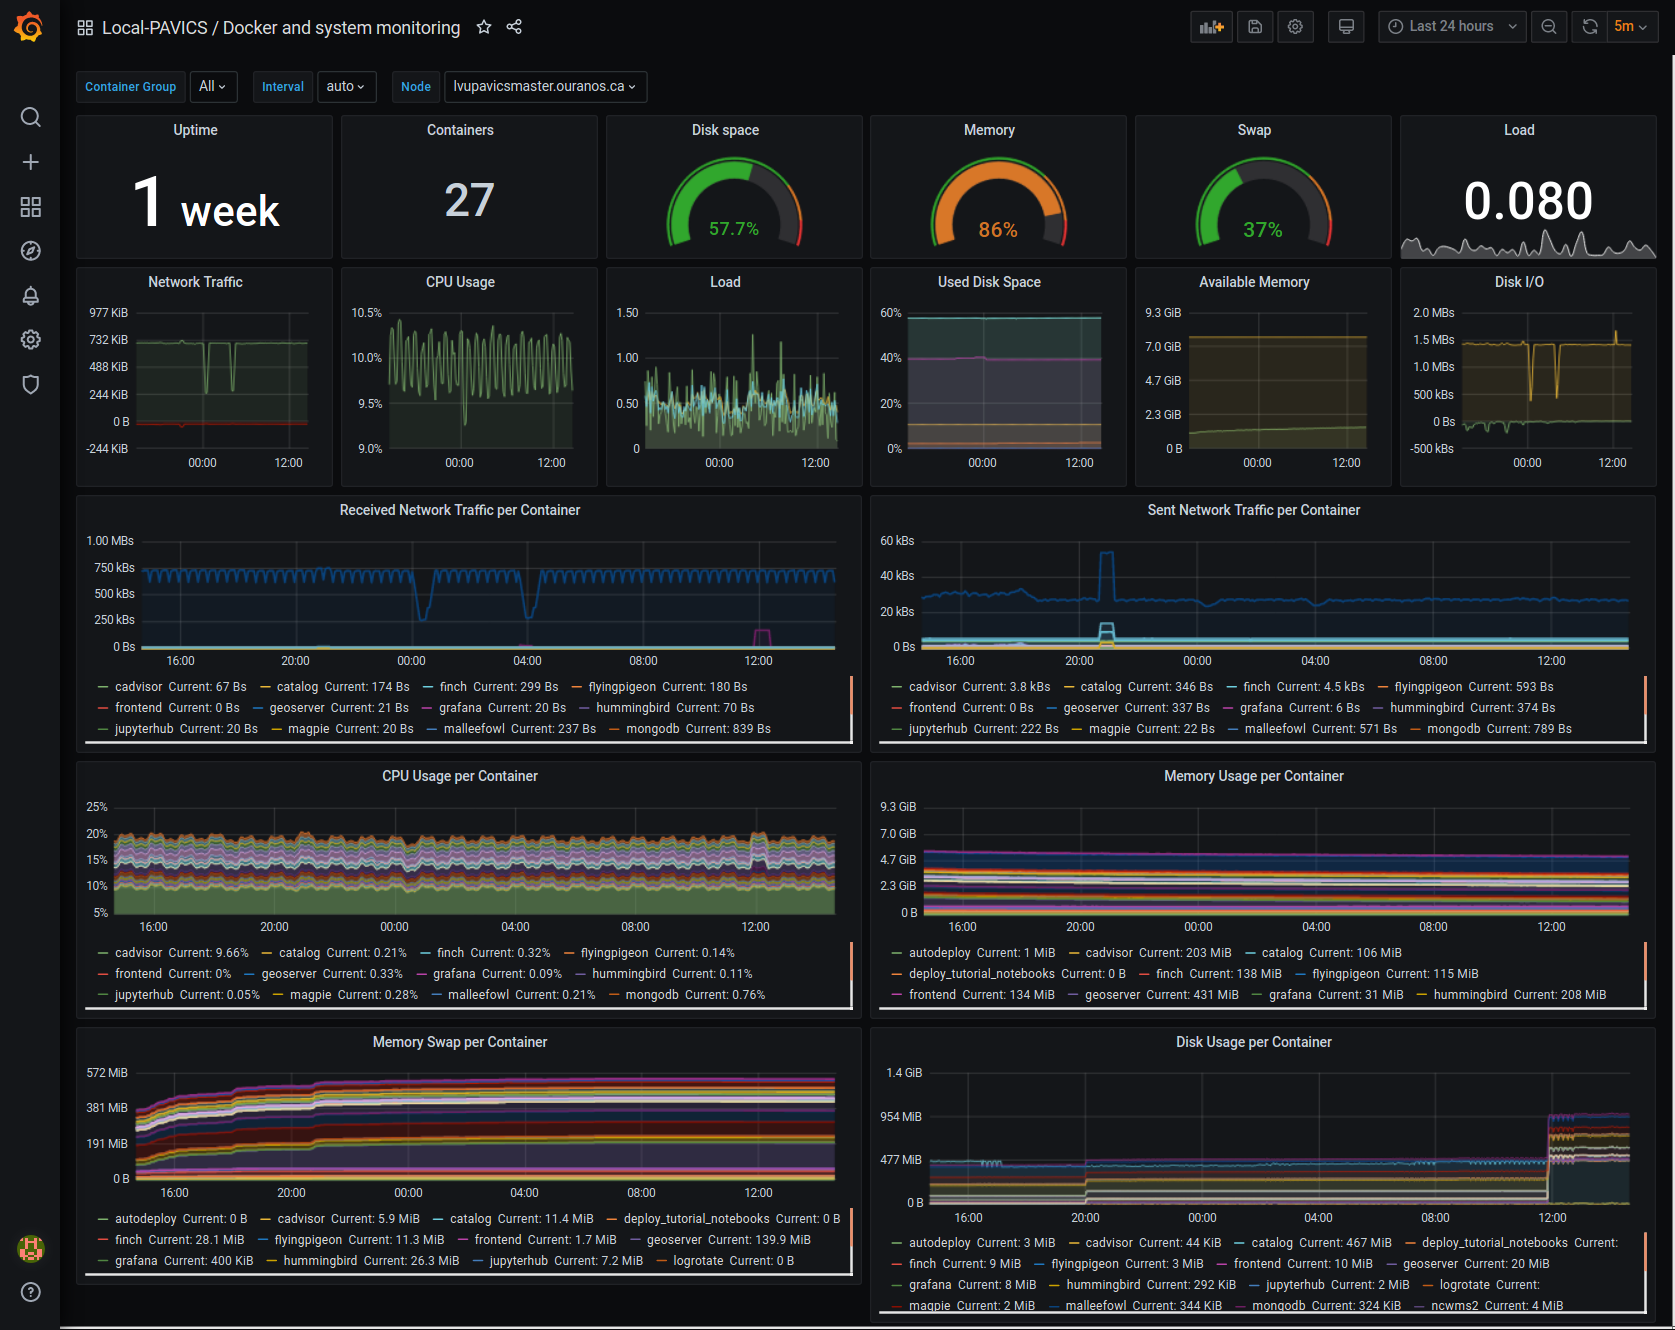
For host, using Node-exporter to collect metrics:
uptime
number of container
used disk space
used memory, available memory, used swap memory
load
cpu usage
in and out network traffic
disk I/O
For each container, using cAdvisor to collect metrics:
in and out network traffic
cpu usage
memory and swap memory usage
disk usage
Useful visualisation features:
zoom in one graph and all other graph update to match the same “time range” so we can correlate event
view each graph independently for more details
mouse over each data point will show value at that moment
Prometheus Alert Rules
AlertManager for Alert Dashboard and Silencing
Customizing the Component
To add more Grafana dashboard, volume-mount more
*.jsonfiles to the grafana container.To add more Prometheus alert rules, volume-mount more
*.rulesfiles to the prometheus container.To disable existing Prometheus alert rules, add more Alertmanager inhibition rules using
ALERTMANAGER_EXTRA_INHIBITIONviaenv.localfile.Other possible Alertmanager configs via
env.local:ALERTMANAGER_EXTRA_GLOBAL,ALERTMANAGER_EXTRA_ROUTES(can route to Slack or other services accepting webhooks),ALERTMANAGER_EXTRA_RECEIVERS.
Weaver
By enabling this component, the Weaver service will be integrated into the stack.
This component offers OGC API - Processes interface to WPS components (a.k.a WPS-REST bindings and WPS-T (Transactional) support). This provides a RESTful JSON interface with asynchronous WPS processes execution over remote instances. Other WPS components of the birdhouse stack (finch, flyingpigeon, etc.) will also all be registered under Weaver in order to provide a common endpoint to retrieve all available processes, and dispatch their execution to the corresponding service. Finally, Weaver also adds Docker image execution capabilities as a WPS process, allowing deployment and execution of custom applications and workflows.
Usage
Once this component is enabled, Weaver will be accessible at https://<PAVICS_FQDN_PUBLIC>/weaver endpoint,
where PAVICS_FQDN_PUBLIC is defined in your env.local file.
Full process listing (across WPS providers) should be available using request:
GET https://<PAVICS_FQDN_PUBLIC>/weaver/processes?providers=true
Please refer to the Weaver OpenAPI for complete description of available requests.
This description will also be accessible via https://<PAVICS_FQDN_PUBLIC>/weaver/api once the instance is started.
For any specific details about Weaver configuration parameters, functionalities or questions, please refer to its documentation.
How to Enable the Component
Edit
env.local(a copy of env.local.example)Add
"./components/weaver"toEXTRA_CONF_DIRS.Component
birdhouse/optional-components/all-public-accessshould also be enabled to ensure that Weaver can requestGetCapabilitiesof every WPS provider to be registered. Publicly inaccessible services will not succeed registration and will not provide the WPS-REST interface.
Customizing the Component
Edit
env.local(a copy of env.local.example)Optionally, set any additional environment variable overrides amongst values defined in weaver/default.env.
Optionally, mount any additional Weaver-specific configuration files (see contents of
birdhouse/components/weaver/config/weaver) if extended functionalities need to be defined. Furtherdocker-compose-extra.ymlcould be needed to define any othervolumesentries where these component would need to be mounted to.
Cowbird
Cowbird is a middleware that manages interactions between various birds of the bird-house stack.
It relies on the existence of other services under a common architecture, but applies changes to the resources under those services such that the complete ecosystem can seamlessly operate together (see Components Diagram).
The code of this service is located in Ouranosinc/cowbird. Its documentation is provided on ReadTheDocs.
Operations Performed by Cowbird
Synchronize Magpie user and group permissions between “corresponding files” located under different services. For example, THREDDS user-workspace files visualized in the catalog will be accessible by the same user under the corresponding user-workspace under GeoServer.
Synchronize Weaver endpoints to retrieve equivalent definitions under various paths and access to generated WPS outputs following a job execution by a given user.
Synchronize permissions between API endpoints and local storage files.
Synchronize permissions and references based on event triggers and request callbacks.
Usage
Cowbird is intended to work on its own, behind the scene, to apply any required resource synchronization between the various services of the platform when changes are detected. Therefore, it does not require any explicit interaction from users.
In case the platform maintainer desires to perform manual syncing operations with Cowbird, its REST API should be used.
It will be accessible under https://{PAVICS_FQDN_PUBLIC}/cowbird and details of available endpoints will be served
under /cowbird/api. Note that Magpie administrator credentials will be required to access those endpoints.
How to Enable the Component
Edit
env.local(a copy of env.local.example)Add
"./components/cowbird"toEXTRA_CONF_DIRS.
Customizing the Component
Cowbird can be affected by multiple variables defined globally on the
stack (i.e.: env.local, a copy of env.local.example). It also considers variables of other services such as
THREDDS, GeoServer, Magpie, etc. in order to perform required interactions between them.
By default, variables defined in cowbird/default.env will be used unless overridden in env.local. To apply changes
define your custom values in env.local directly.